View Asset Analytics
Analytics shows how an asset is being watched: how many views it gets, how long people watch, and who watched. The Analytics tab is available to managers.
Open analytics
- Open the asset and select the Analytics tab
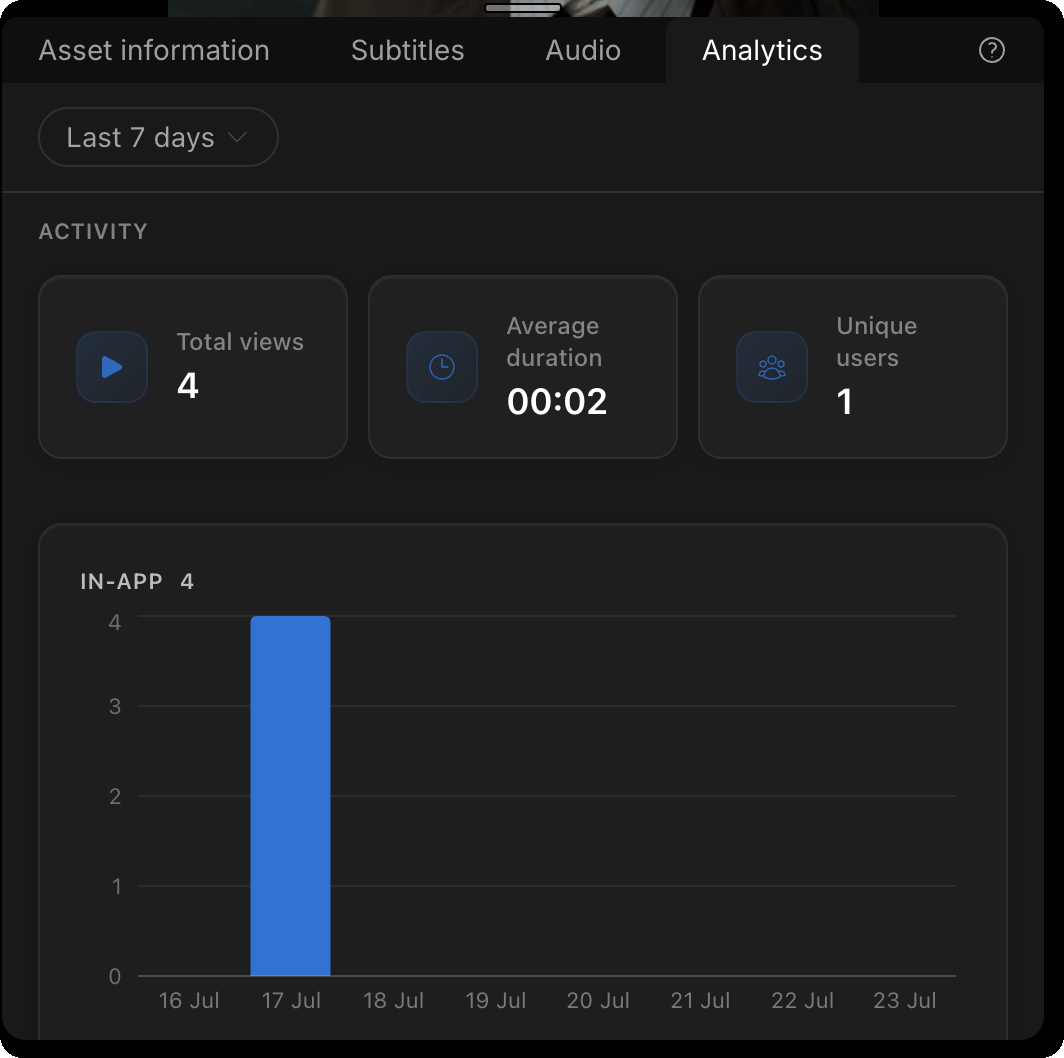
- The page opens on the Last 7 days period by default
- Use the period dropdown to switch between Last 7 days, This month, Previous month, or Custom dates. Custom dates let you pick a start and end date
Read the overview
The Activity section summarises the selected period:
- Total views - the number of times the asset was played
- Average duration - the average length of a viewing session
- Unique users - the number of distinct people who watched
Two charts break views down by day: In-app (views inside MediaBench) and Shares (views through share links). The Viewed segments chart shows which parts of the video were watched most.
Inspect the activity log
The Activity log lists individual views with these columns:
- Timestamp - when the view happened
- User - who watched
- Duration - how long they watched
- Location - the viewer's country
- Device - the device type
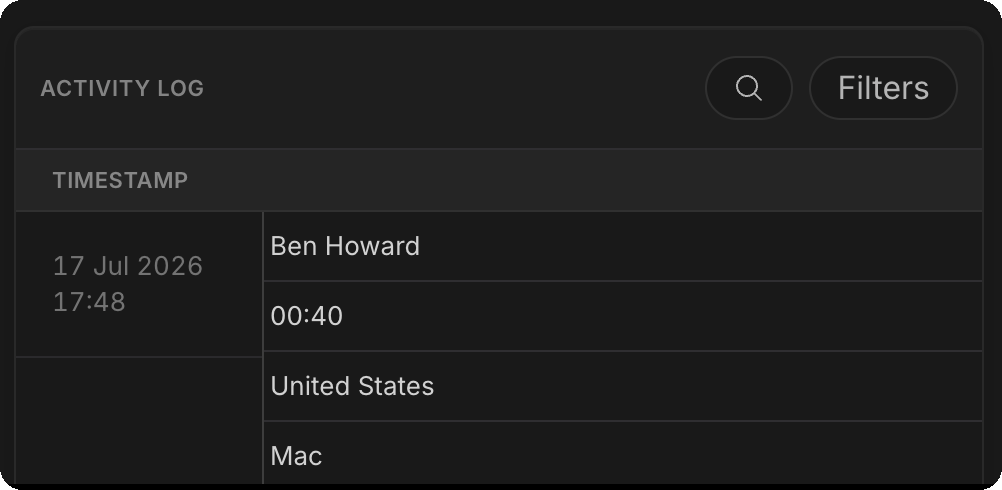
Filter the log by View source (In-app or Shares), Device, or Location, or search by name.
note
Analytics is visible to managers only.